 Telemetry
Metrics, logs and alerts for every robot you ship.
See how every device in the fleet is doing, search what it logged, and get told the moment something drifts. Built into AdmiralOS, so there is no agent to install.
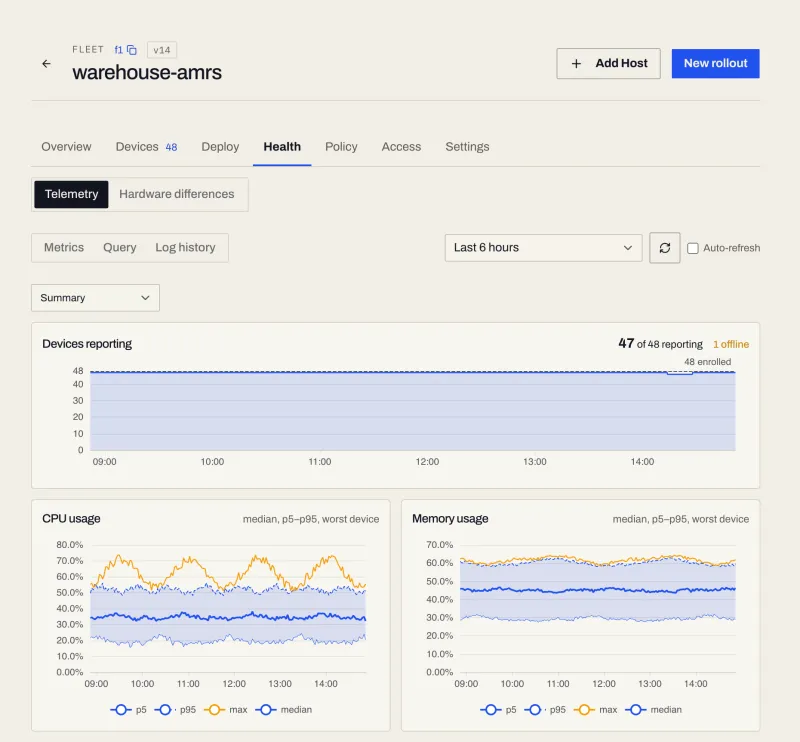
Metrics
Every device, already instrumented.
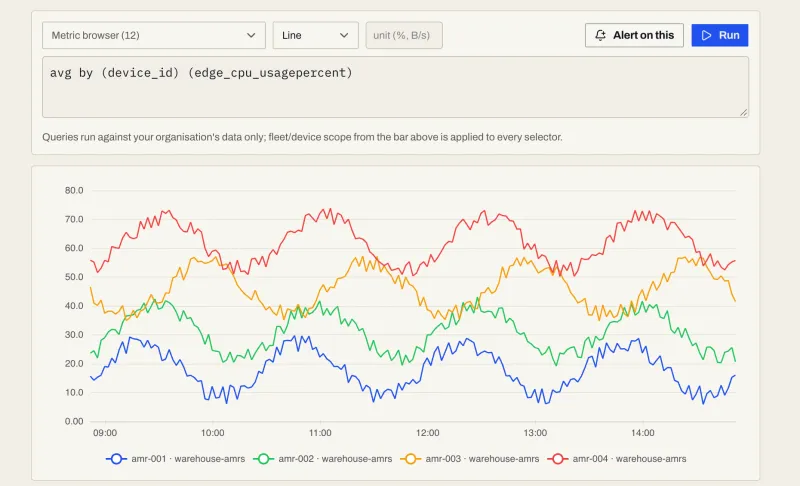
CPU, memory, disk, temperature, load, network and battery arrive from every AdmiralOS device with no agent to install. Chart them across the fleet, by fleet or by device, or query anything in MetricsQL.
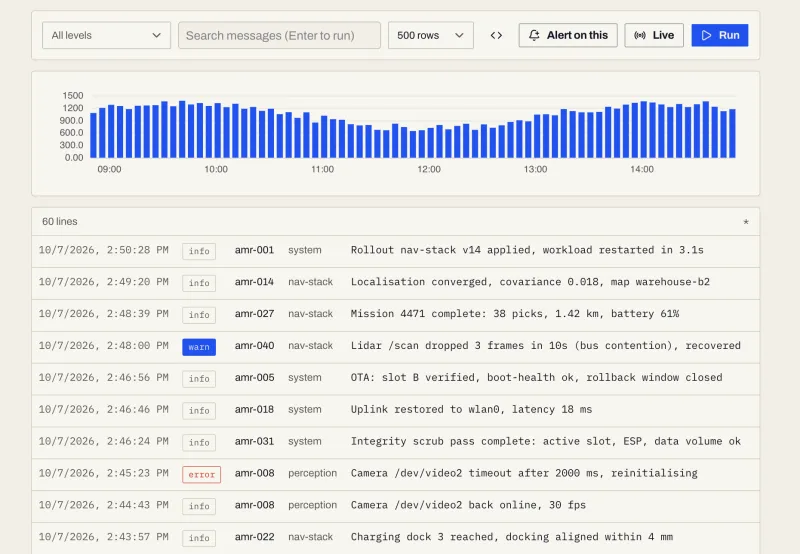
Logs
Search every log line, from every robot.
Your workload, the kernel and the system, stored and searchable across the fleet. A histogram shows when it happened, LogsQL narrows it down, and Live tails new lines as they arrive.
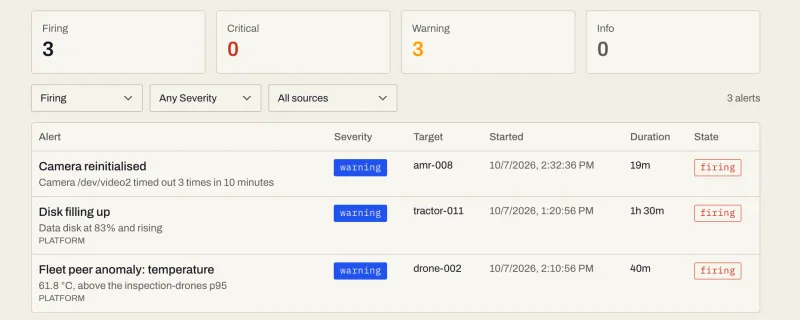
Alerts
Know before the customer calls.
Built-in alerts for offline robots, fleet outages, overheating, full disks, failing SMART checks, kernel panics and out-of-memory kills run from day one. No setup.
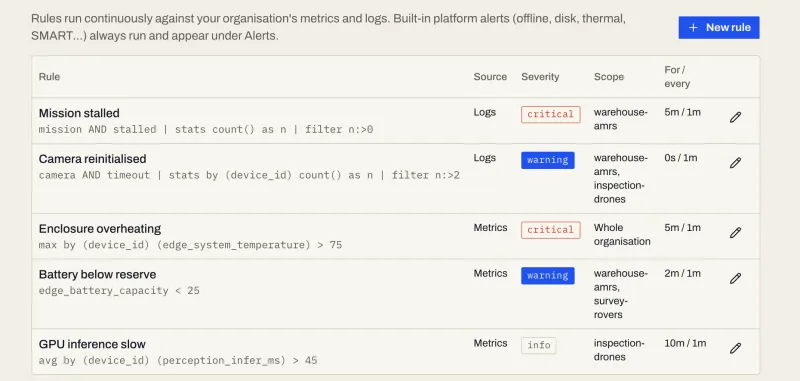
Alert rules
Turn any query into an alert.
Write a rule against any metric or log query, or click Alert on this from a chart. Scope it to a fleet, choose the severity, and send it in-app or to your webhooks.
Built in
Alerts that run from the first device.
Platform alerts need no setup. They are grouped and rate-limited, a fleet-wide outage suppresses the per-device noise, and every one can be delivered to your webhooks.
Device offline
No telemetry for 5 minutes
Fleet mass outage
More than 30% of a fleet offline
Connectivity flapping
Link changing state over and over
Overheating
Above 70 °C, critical above 80 °C
Disk filling up
Data disk above 80%, or full within 24 hours
Disk SMART failing
Bad sectors, flash wear and failing drives
Kernel panic or OOM kill
Read straight from the device log
Peer anomalies
A robot running hotter or busier than its fleet
For engineers
Query it like you already do.
PromQL-compatible MetricsQL for metrics, LogsQL for logs, and the same API the console uses. Every request stays inside the fleets and devices the caller can see.
- Retention
- Resolved alerts kept for 90 days
- Query languages
- MetricsQL (PromQL-compatible) and LogsQL
- Delivery
- In-app notifications and webhooks
- Access
- Scoped to the fleets and devices each person can see
- API
- Every query and rule available under /v1/telemetry and /v1/alerting
- Agents
- None. Built into AdmiralOS
Alert on any query
curl -X POST https://api.admrl.co/v1/alerting/rules \
  -H "Authorization: Bearer $TOKEN" \
  -d '{
    "name": "Enclosure overheating",
    "datasource": "metrics",
    "expr": "max by (device_id) (edge_system_temperature) > 85",
    "for_seconds": 300,
    "severity": "critical",
    "notify_webhooks": true
}' Pricing
Health is included. History is a tier.
Every AdmiralOS device reports its live health for free. Add Telemetry when you want fleet-wide history, search and your own alerting.
Included with AdmiralOS
Every plan
Live health for every device, from the first one.
- Device and fleet health: CPU, memory, disk, temperature
- Real-time logs from a single device
- Built-in platform alerts
- In-app notifications
Telemetry
Add-on, priced per device
Fleet-wide history, search and your own alerting.
- Metric history and the MetricsQL explorer
- Log history and search across the fleet, with live tail
- Custom alert rules on any metric or log query
- Webhook delivery for every alert
- Telemetry API for your own dashboards and pipelines
Get started
See your fleet the way it actually runs.
We will walk you through Telemetry on a fleet like yours.